The T-REX web server allows users to perform several popular methods of phylogenetic analysis as well as some new phylogenetic applications for inferring, drawing and validating phylogenetic trees and networks which we have developed. The latest web server version of T-REX includes:
Methods for the visualization and interactive manipulation of phylogenetic trees using Hierarchical vertical, Hierarchical horizontal, Radial and Axial types of tree drawing
(Barthélemy and Guénoche 1991). For instance, the Newick Viewer application allows users to visualize a tree coded by its Newick string.
An application for drawing phylogenetic trees, allowing for saving them in the Newick format. This program requires the support of the Canvas program by the user’s browser.
Canvas is supported by many web browsers including Internet Explorer (starting from version 9.0), Firefox (starting from version 2.0) and Safari (staring from version 3.1).
A detailed user guide specifying how to create or remove node(s) and branch(es) of a phylogenetic tree is supplied for this application.
Methods for inferring and validating phylogenetic trees using distances: Neighbor Joining (NJ),
NINJA large-scale Neighbor Joining,
BioNJ, UNJ,
ADDTREE, MW,
FITCH and Circular order reconstruction,
maximum parsimony: DNAPARS, PROTPARS, PARS and DOLLOP, all of them from the PHYLIP package,
and maximum likelihood: PHYML, RAxML.
DNAML, DNAMLK, PROML and PROMLK, the four latter methods are from the PHYLIP package.
For most of the available algorithms, T-REX also carries out bootstrap
resampling to assess support of the tree branches. Here, we will give more details on the methods developed by the members of our research group.
Circular order reconstruction method builds a phylogeny using a circular order of taxa associated
with a given matrix of evolutionary distances. This fitting method was inspired by Yushmanov's paper
which introduced the concept of circular orders of taxa corresponding to the clockwise scanning of leaves of a phylogenetic tree. The MW (method of weights) procedure
searches for the best phylogenetic tree, in the least-squares sense, with respect to the given distance and weight matrices. This method allows for arbitrary weights
which may be chosen according to one of the traditional weighting models. The tree obtained by any of the seven available distance-based methods is
then polished using the procedure of quadratic approximation of its branch lengths (see Barthélemy and Guénoche 1991) in the unweighted case and (Sattath and Tversky, 1977)
in the weighted case) which is carried out to improve the value of the least-squares criterion while avoiding negative branch lengths.
Methods for reconstructing phylogenetic trees from a distance matrix containing missing values, i.e. incomplete matrices. The following four fitting methods are available:
Triangles method by Guénoche and Leclerc (2001), Ultrametric procedure for the estimation of missing values by Landry, Lapointe and Kirsch (1996) followed by NJ, Additive
procedure for the estimation of missing values by Landry, Lapointe and Kirsch (1996) followed by NJ, and the Modified Weighted least-squares method (MW*) by Makarenkov and Lapointe (2004).
The MW* method assigns the weight of 1 to the existing entries, the weight of 0.5 to the estimated entries and the weight of 0 when the entry estimation was impossible.
The simulations described in (Makarenkov and Lapointe 2004) showed that the MW* method clearly outperforms the Triangles, Ultrametric and Additive procedures.
A method for inferring reticulograms from distance matrices. The reticulogram reconstruction program first builds a supporting phylogenetic tree using one of the existing tree inferring methods.
Following this, a reticulation branch that minimizes the least-squares or the weighted least-squares objective function is added to the tree (or network starting from Step 2) at each step of the
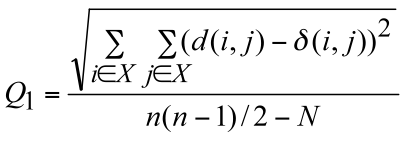
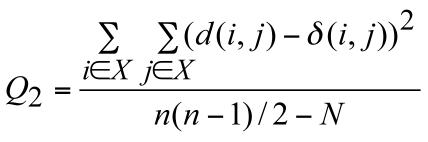
algorithm (Legendre and Makarenkov 2002). Two statistical criteria, Q1 and Q2, have been proposed in order to measure the gain in fit provided by each reticulation branch:
and
.
The numerator of these functions is the square root of the sum (or the sum itself) of the quadratic differences between the values of the given evolutionary distance δ and the
corresponding reticulogram estimates d, n is the number of taxa in the considered set X and N is the number of branches in the reticulogram, i.e. total of the phylogenetic tree branches and reticulation branches.
The minimum of Q1 and Q2 can define a stopping rule for the addition of reticulation branches. A predefined number of reticulation branches, K, can also be added to the supporting tree.
The web server version of T-REX also provides the possibility of inferring the supporting tree from one distance matrix and then for adding reticulation branches using another distance matrix.
Such an algorithm can be useful for depicting morphological or genetic similarities among given species or for identifying HGT events by using the first distance matrix to infer the species tree and the second
matrix (containing the gene-related distances) to infer the reticulation branches representing putative horizontal gene transfers (Legendre and Makarenkov 2002, Makarenkov and Legendre 2004).
Complete and partial HGT detection and validation methods. The HGT-Detection program aims to determine an optimal, i.e. minimum-cost, scenario of horizontal gene transfers while proceeding by a
gradual reconciliation of the given species and gene trees (Boc et al. 2010). This algorithm was shown to be faster and generally more effective than the LatTrans (Hallett and Lagergren 2001)
and RIATA-HGT (Than et al. 2008) techniques. Statistical validation of the obtained gene transfers by bootstrapping can be performed. The HGT bootstrap scores of the predicted gene
transfers are obtained by taking into account the uncertainty of the gene tree as well as the number of occurrences of the selected transfers in all minimum-cost HGT scenarios found for the
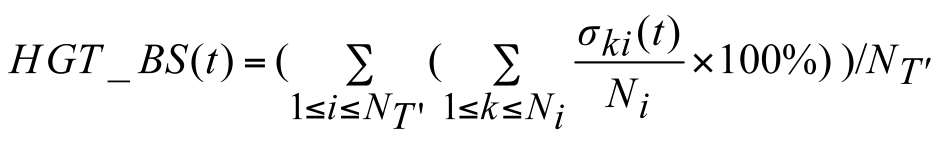
given species tree and the generated gene tree replicates (Boc et al., 2010, Boc and Makarenkov 2011). The following formula is used to compute the bootstrap score HGT_BS of the transfer t
obtained while reconciling the species tree T and the gene tree T’:
where σki(t) is equal to 1 if the transfer t is a part of the minimum-cost scenario k for the gene tree Ti' and equal to 0, otherwise, NT’ is the number of gene tree replicates, i.e. number of
HGT bootstrap replicates, generated from resampled gene sequences and Ni is the number of minimum-cost scenarios obtained when carrying out the algorithm with the species tree T, which is
assumed to be fixed, and the partial gene tree Ti’. HGT Consensus, Parallel and Interactive versions of the HGT-Detection algorithm are also available. The Consensus version of the algorithm
yields a consensus HGT scenario obtained for a given species tree and a set of gene trees. The Parallel version allows the user to speed up the HGT computation by executing the program on a
32-processor Linux cluster, whereas the Interactive version allows the user to pre-define some HGTs and then accept, reject or change the direction of each transfer proposed by the HGT-Detection
algorithm during the program execution. A version of the program allowing for identifying partial HGT scenarios, when only a part of the gene is acquired by the host allele through intragenic
recombination, is also provided (Boc and Makarenkov 2011). Note that the results of the HGT detection algorithms depend on the position of the species and gene tree roots.
The user can select the tree roots by checking the appropriate check boxes prior to launching the computation.
MAFFT (Katoh et al. 2004), MUSCLE (Edgar 2004) and ClustalW (Thompson et al. 1994) algorithms, which are among the most widely used multiple sequence alignment tools, are available with slow and fast pairwise
alignment options.
Computation of the Robison and Foulds (RF) topological distance. This program computes the RF topological distance (Robinson and Foulds 1981), which is a popular measure of the trees similarity,
between the first tree and all the following trees specified by the user. The trees can be supplied in the Newick or Distance matrix formats. An optimal algorithm described in (Makarenkov and Leclerc 2000)
is carried out to compute the RF metric.
Newick to Distance matrix and Distance matrix to Newick format conversion. This application allows the user to convert a phylogenetic tree from the Newick format to the Distance matrix
format and vice versa.
Random phylogenetic tree generation program. This application generates k random phylogenetic trees with n leaves, i.e. species or taxa, and an average branch length l using the random
tree generation procedure described by Kuhner and Felsenstein (1994), where the variables k, n and l are defined by the user. The branch lengths of trees follow an exponential distribution.
The branch lengths are multiplied by 1+ax, where the variable x is obtained from an exponential distribution (P(x>k) = exp(-k)), and the constant a is a tuning factor accounting for the deviation
intensity (as described in (Guindon and Gascuel 2002), the value of a was set to 0.8). The random trees generated by this procedure have depth of O(log (n)).
T-REX results and their interpretation
The three main types of results provided by T-REX are the following:
A phylogenetic tree, or evolutionary tree, is a branching diagram representing the inferred evolutionary relationships among a group of species or other types of taxa based upon similarities and differences in their genetic and/or physical characteristics. The species linked together in the phylogenetic tree are assumed to have descended from a common ancestor (Felsenstein 2004).
Phylogenetic trees can be inferred from distance matrices (i.e., phenetic approach) or from sequence data (i.e., cladistic approach). The phenetic approach relies on evolutionary distance data and requires relatively few assumptions. In this approach, a tree is constructed by considering the phenotypic similarities among the species. The cladistic methods of phylogenetic analysis are based on the explicit assumption that a set of sequences evolved from a common ancestor by a process of mutation and selection without mixing (i.e., hybridization or horizontal gene transfer).
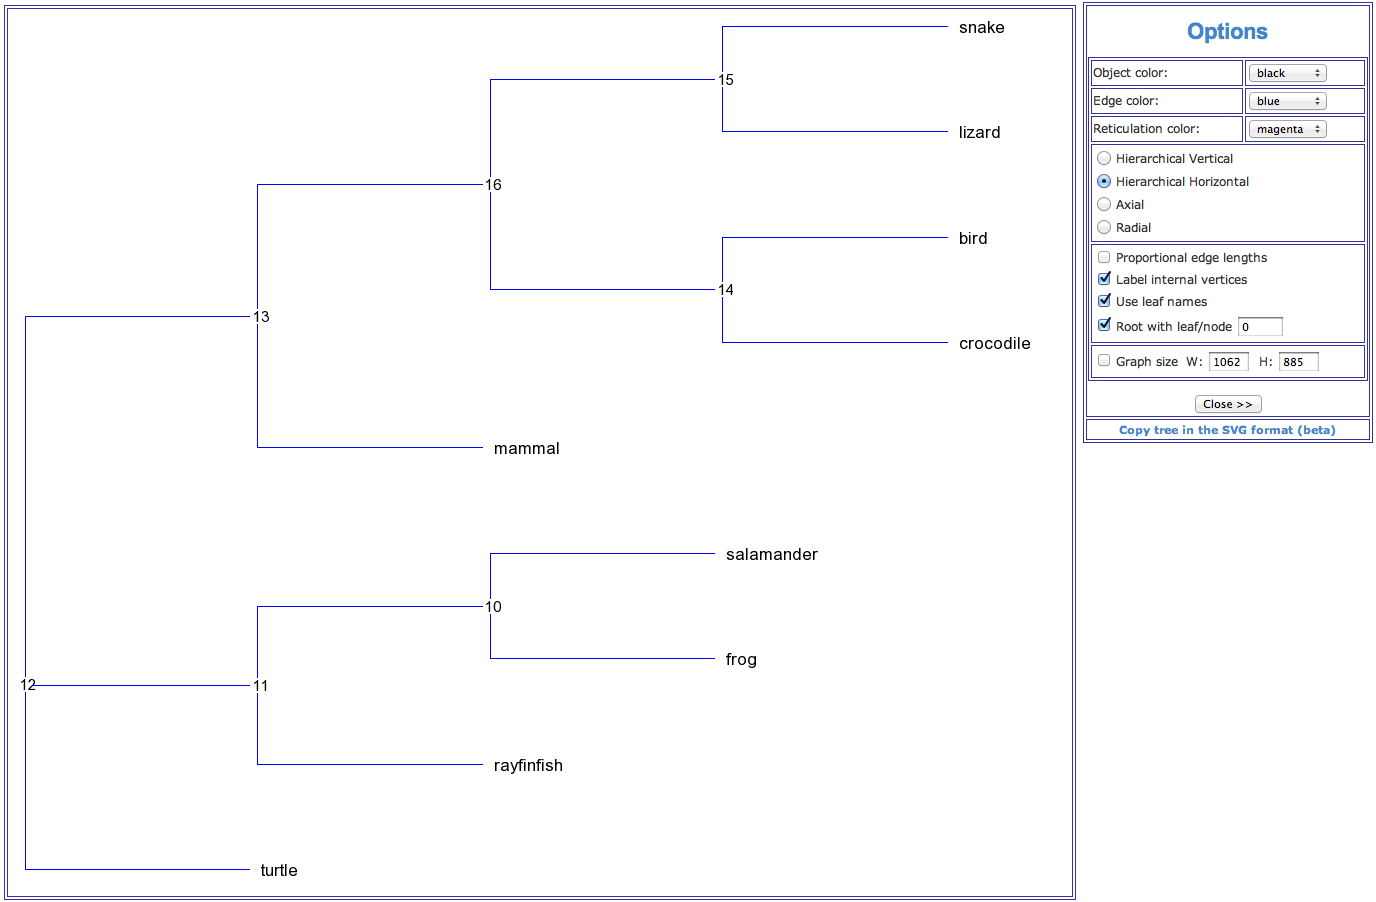
As results of the phylogenetic inferring T-REX provides: A phylogenetic tree drawing (see Fig. 1 below), the fitting statistics and the resulting tree coded in the Newick format. The fitting statistics include the fitted tree distance matrix, list of tree branches with their lengths and, if computed, their bootstrap scores. For most of the available methods, the values of the (weighted) least-squares coefficient, (weighted) average absolute difference, (weighted) maximum absolute difference and total lengths of the obtained tree are also provided.
Figure 1. An example of a phylogenetic tree (hierarchical view) showing phylogenetic relationships for a group of 9 vertebrate species.
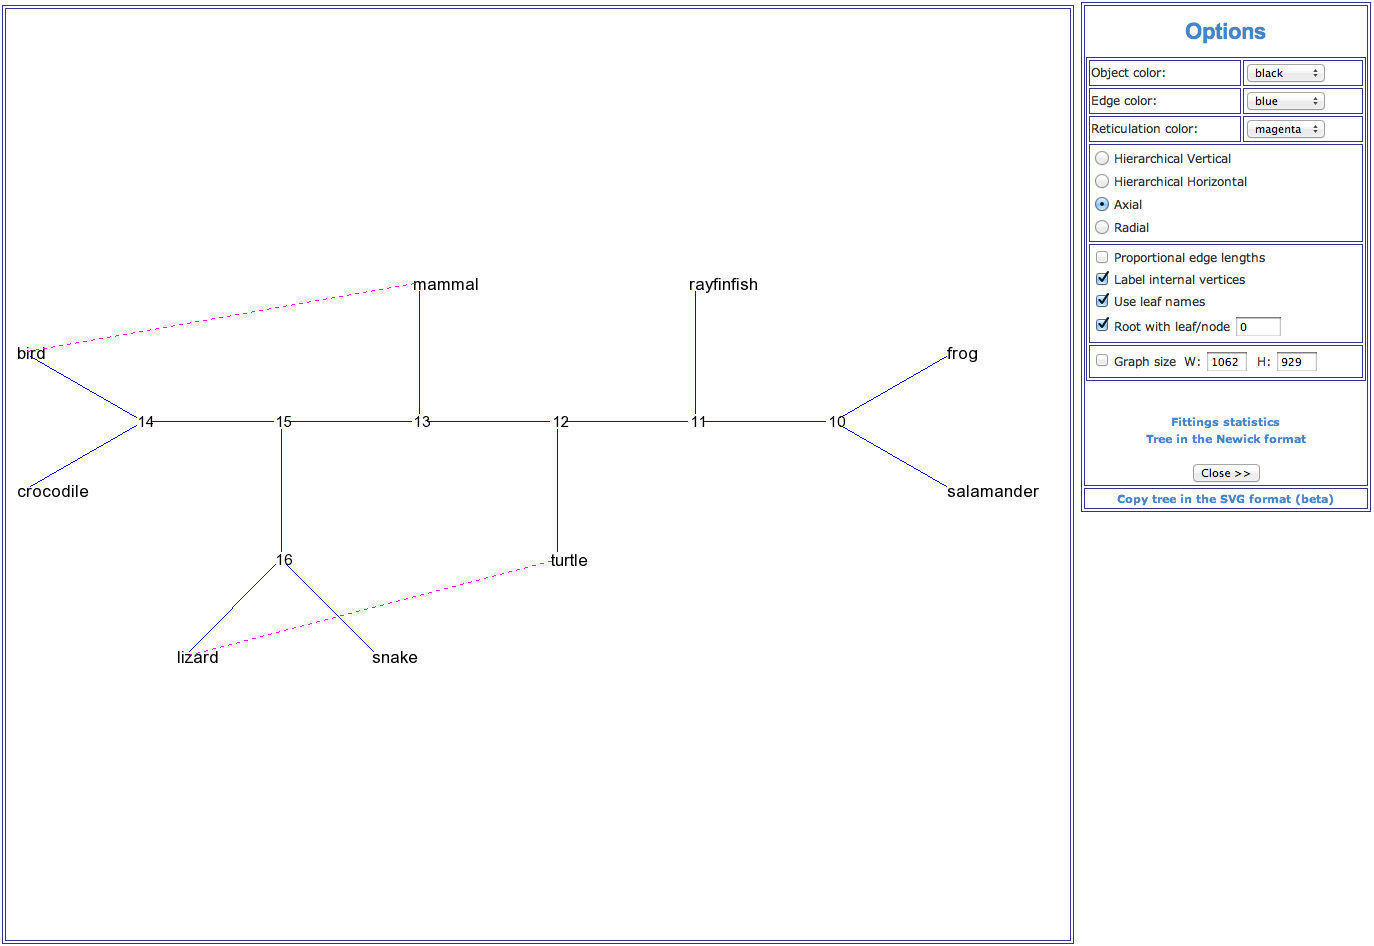
A reticulogram (i.e., reticulated cladogram) is a general species or taxa network capable of representing a reticulate evolutionary history. It is useful for portraying relationships among organisms that may be related in a nonunique way to their common ancestor – relationships that cannot be represented by a traditional phylogenetic tree. Reticulate patterns of relationships can characterize many phylogenetic and biogeographic mechanisms, including: Hybridization between species, comprising allopolyploidy in plants, horizontal gene transfer in bacteria and viruses, microevolution of local populations within a species, historical biogeography, and, finally, homoplasy, which is the portion of phylogenetic similarity resulting from evolutionary convergence (Legendre and Makarenkov 2002 and Makarenkov and Legendre 2004).
As results of the reticulogram inferring T-REX provides: A reticulogram drawing (see Fig. 2 below) and the fitting statistics. The fitting statistics include the fitted reticulogram distance matrix and the list of reticulogram branches with their lengths. If the reticulogram reconstruction is performed, T-REX also provides the values of the least-squares criterion as well as the values of the selected stopping criterion Q1 or Q2 for the supporting tree topology and for each reticulation branch added to the supporting tree.
Figure 2. An example of a reticulogram (axial view) showing phylogenetic relationships for a group of 9 vertebrate species. The reticulation branches (represented by dashed lines) linking the species (bird – mammal) and (lizard – turtle) suggest that the connected species are more closely phylogenetically related than it is shown by the traditional phylogenetic tree model.
A horizontal gene transfer (HGT) network consists of a traditional phylogenetic (i.e., species) tree with a set of directed branches representing horizontal (i.e., lateral) transfers of the given gene (gene data can be supplied as a multiple sequence alignment or as a gene tree in the Newick format). HGT is a direct transfer of genetic material from one lineage to another. Bacteria and Archaea have developed sophisticated mechanisms for the acquisition of new genes via HGT, which may have been favored by natural selection as a more rapid way of adaptation than the alteration of gene functions through numerous point mutations (Doolittle 1999, Gogarten et al. 2002 and Zhaxybayeva et al. 2004). The three main types of HGT are transformation, assuming the uptake of naked DNA from the environment, conjugation which is mediated by conjugal plasmids or transposons, and transduction, implying DNA transfer by phage (Boc et al. 2010). Two models of HGT have been considered in the literature (Makarenkov et al. 2006). First, and the most popular of them, is the traditional model of complete HGT (Maddison 1997 and Page and Charleston 1998). This model assumes that the transferred gene either displaces the orthologous gene of the recipient genome or, when absent in the recipient genome, the transferred gene is incorporated into it. The second model is that of partial gene transfer, which involves the formation of "mosaic" genes (Boc and Makarenkov 2011). A mosaic gene consists of interspersed blocks of sequences having different evolutionary histories but found combined in the resulting allele subsequent to the partial HGT and intragenic recombination events (Hollingshead et al. 2000, Zhaxybayeva et al. 2004).
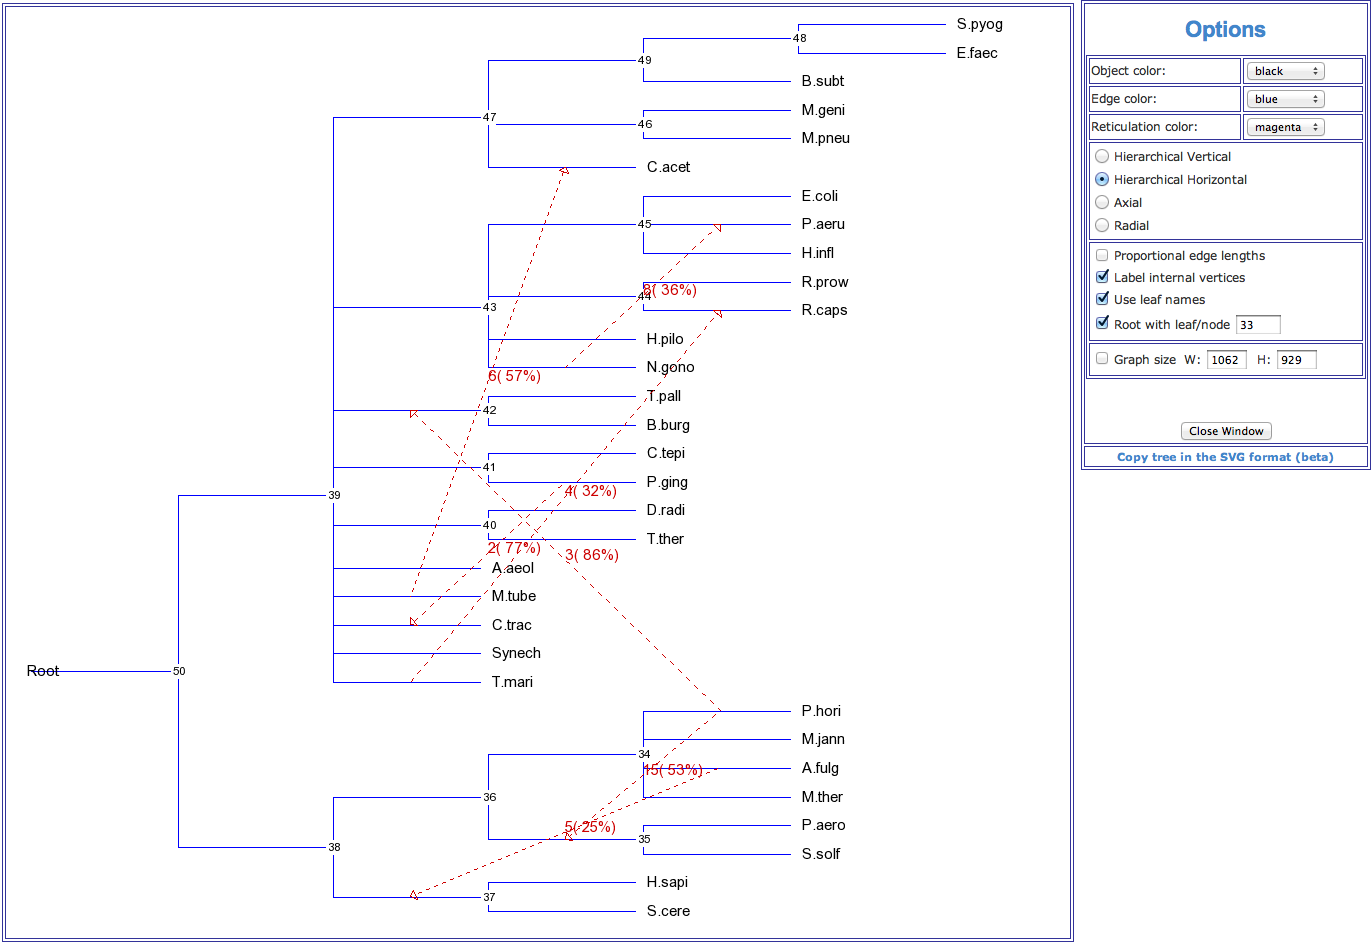
As results of the HGT inferring T-REX provides: A horizontal gene transfer network in which gene transfers are indicated by dashed arrows. Numbers on transfers indicate their order of inference (except for the partial HGT inferring). HGT bootstrap scores, if inferred, are indicated between parentheses and the affected intervals, for the partial HGT inferring only, are indicated between brackets. The results text file also contains the values of the bipartition dissimilarity Boc et al. 2010), the Robinson and Foulds topological distance and the least-squares coefficient between the species and gene trees, which are provided at each step of the HGT inferring algorithm, the list of HGT branches with their bootstrap scores and the affected intervals (for the partial HGT inferring only). The HGT Consensus algorithm allows the user to infer a consensus HGT scenario. The Interactive version of the HGT inferring program allows the user to specify his/her own gene transfers as well as to validate all the transfers proposed by the algorithm by accepting them, rejecting them or changing the transfers’ direction.
Figure 3. An example of a horizontal gene transfer network showing horizontal transfers of the gene pheRS inferred for the group of 32 species originally considered by Woese et al. (2000). Gene transfers are indicated by dashed arrows. Numbers on transfers designate their order of inference. HGT bootstrap scores are indicated between parentheses.